© 2024. The Author(s).
**
Fig. 1. Glucose deprivation increases lipolysis via…
**
**
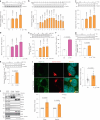
Fig. 1. Glucose deprivation increases lipolysis via ATGL stabilization in the adipose depots and liver.
**
Fig. 1. Glucose deprivation increases lipolysis via ATGL stabilization in the adipose depots and liver.
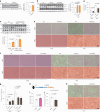
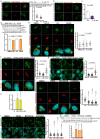
a,b, Quantification of plasma FFA levels (a) and ATGL levels (b) in the liver and adipose depots after 24 h fasting (n = 6 mice per group). c, Plasma FFA levels in the mice 1 h, 6 h and 12 h after 2-DG (2 g kg−1 BW) administration (1 h and 6 h, n = 6 mice for saline and 8 mice for 2-DG group; 12 h, n = 10 mice for saline and 13 mice for 2-DG group). d, Quantification of ATGL levels in the liver and adipose depots collected 1 h, 6 h and 12 h after 2-DG administration (1 h and 6 h, n = 6 mice for saline and 8 mice for 2-DG group; 12 h, n = 12 mice for saline and 15 mice for 2-DG group). e, Representative immunofluorescence of ATGL in the iBAT collected 6 h after 2-DG administration. Scale bar, 20 μm. Representative images from three mice per group with similar results. f, Plasma FFA levels in the wild-type mice after 2-DG treatment for 5.5 h, followed by insulin (0.75 U kg−1 BW) administration for 30 min (n = 8 mice per group). g, Plasma FFA levels in the wild-type mice 6 h after co-administration of 2-DG and insulin (n = 8 mice per group). h,i, Quantification of ATGL and HSLSer660ph levels in the subcutaneous adipose tissue taken before and after EHC from patients with insulin sensitivity or resistance (n = 16 patients with insulin sensitivity in h; n = 8 patients with insulin resistance in i). Data are presented as mean ± s.e.m. and analysed using two-tailed unpaired t-test (a–d (1 h in liver, iBAT, 1 h and 6 h in iWAT, and 1 h and 6 h in gWAT)), two-tailed paired t-test (i), two-tailed Mann–Whitney test (d (6 h and 12 h in liver, 12 h in iWAT and 12 h in gWAT)), two-tailed Wilcoxon test (h) and one-way ANOVA method with Tukey correction (f and g). Source numerical data are available in . Source data
**
Fig. 2. Glucose deprivation modulates lipolysis via…
**
**
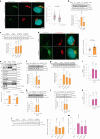
Fig. 2. Glucose deprivation modulates lipolysis via stabilizing ATGL in the Golgi.
**
Fig. 2. Glucose deprivation modulates lipolysis via stabilizing ATGL in the Golgi.
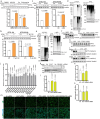
a, Immunoblot of ATGL in HepG2 cells cultured at different glucose (Glc) concentrations for 6 h (n = 6 independent experiments per group). b, Immunoblot of ATGL in HepG2 cells treated with 50 mM 2-DG and collected at indicated timepoints (n = 9 or 3 independent experiments for control or 2-DG groups). c, Immunoblot of ATGL in iBAs cultured at different glucose concentrations for 24 h (n = 6 independent experiments per group). d, Levels of NEFAs in the starvation medium released by iBAs in the basal state 24 h after treatment with medium at different glucose concentrations (n = 6 independent experiments per group). e, Immunoblot of ATGL in iBAs treated with 2-DG at indicated concentrations for 24 h (n = 4 independent experiments per group). f, Levels of NEFAs in the starvation medium released by iBAs in the basal state 24 h after treatment with control vehicle (Ctr) and 100 mM 2-DG (n = 5 independent experiments per group). g, Immunoblot of ATGL in HEK293T cells 6 h after glucose withdrawal (n = 4 independent experiments per group). h, Immunoblot of ATGL in HEK293T cells 12 h after treatment with Ctr and 50 mM 2-DG (n = 4 independent experiments per group). i, Immunofluorescence of ATGL in HEK293-AAV cells 6 h after treatment with glucose free medium (n = 43 cells per group). Scale bar, 5 μm. j, Immunoblot of ATGL in the WCE, Golgi and vesicle fractions extracted from HEK293T cells 6 h after glucose withdrawal (n = 6 independent experiments per group). Results are shown as mean ± s.e.m. and analysed using two-tailed unpaired t-test (f–i), two-tailed paired t-test (j), one-way ANOVA method with Dunnett correction for multiple comparisons between control and other groups (a–c and e) and Kruskal–Wallis test with Dunn’s correction for multiple comparisons between control and other groups (d). Source numerical data and unprocessed blots are available in . Source data
**
Fig. 3. Golgi PtdIns4P regulates ATGL protein…
**
**
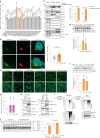
Fig. 3. Golgi PtdIns4P regulates ATGL protein stability in the Golgi apparatus.
**
Fig. 3. Golgi PtdIns4P regulates ATGL protein stability in the Golgi apparatus.
a, Immunofluorescence of PtdIns4P in HEK293-AAV cells after glucose deprivation (n = 150 cells per group). Scale bar, 5 μm. b, Immunoblot of ATGL in HEK293T cells 72 h after PI4KB and SACM1L knockdown (n = 8 or 4 independent experiments for control or other groups). c, Immunoblot of ATGL in HEK293T cells 24 h after treatment with 5 μM PIK93, 10 μM BF738735 and 10 μM UCB9608 (n = 6 independent experiments per group). d, Immunofluorescence of ATGL in HEK293-AAV cells 24 h after UCB9608 treatment (n = 61 cells per group). Scale bar, 5 μm. e, Immunoblot of ATGL in the different fractions from HEK293T cells 6 h after UCB9608 treatment (n = 6 independent experiments per group). f, Immunoblot of ATGL in HepG2 cells 72 h after PI4KB and SACM1L knockdown (n = 8 or 4 independent experiments for control or other groups). g, Immunoblot of ATGL in HepG2 cells 24 h after treatment with PIK93, BF738735 and UCB9608 (n = 6 independent experiments per group). h,i, Immunoblot of ATGL and determination of basal lipolysis 72 h after knocking down Pi4kb in the iBAs (n = 8 or 4 independent experiments for control or other groups in h; n = 6 independent experiments per group in i). j,k, Immunoblot of ATGL and determination of basal lipolysis 72 h after knocking down Sacm1l in the iBAs (n = 6 or 4 independent experiments for control or other groups in j; n = 6 independent experiments per group in k). l,m, Immunoblot of ATGL (l) and determination of basal lipolysis (m) 24 h after treating iBAs with 1 μM PIK93, 1 μM BF738735 and 1 μM UCB9608 (n = 6 independent experiments per group). Data are presented as mean ± s.e.m. and analysed using two-tailed paired t-test (e), two-tailed Mann–Whitney test (a and d), one-way ANOVA method with Dunnett correction for multiple comparisons between control and other groups (b, c, f–k and m) and Kruskal–Wallis test with Dunn’s correction for multiple comparisons between control and other groups (l). Source numerical data and unprocessed blots are available in . Source data
**
Fig. 4. The Golgi resident E3 ligase…
**
**
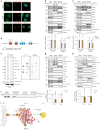
Fig. 4. The Golgi resident E3 ligase complex CUL7 FBXW8 polyubiquitylates ATGL for degradation.
**
Fig. 4. The Golgi resident E3 ligase complex CUL7FBXW8 polyubiquitylates ATGL for degradation.
a, Quantification of ATGL protein levels in HEK293T WCE in a small-scale siRNA screen via immunoblot (n = 18 or 3 independent experiments for control or other groups). b, Immunofluorescence of ATGL in HEK293-AAV cells 72 h after CUL7&FBXW8 knockdown (n = 61 cells per group). Scale bar, 5 μm. c, Immunoblot of ATGL in the WCE, Golgi and vesicle fractions extracted from HEK293T cells 72 h after CUL7&FBXW8 knockdown (n = 6 independent experiments per group). Asterisk indicates a non-specific band. d, Immunoblot of ATGL in HepG2 cells 72 h after CUL7 and FBXW8 knockdown (n = 8 or 4 independent experiments for control or other groups). e, Representative images of LDs stained by BODIPY in HepG2 cells 72 h after siRNA knockdown. Scale bar, 20 μm. Three times repeated independently with similar results. f, Immunoblot of ATGL in iBAs 72 h after Cul7 and Fbxw8 knockdown (n = 8 or 4 independent experiments for control or other groups). g, Levels of NEFAs in the starvation medium released by iBAs in the basal state 72 h after knockdown of Cul7 and Fbxw8 (n = 6 independent experiments per group). h, Co-IP conducted in HEK293T WCE by FLAG antibody 48 h after expressing ATGL–FLAG or FBXW8–FLAG. Three times repeated independently with similar results. i, K48-linkage polyubiquitylation pattern detection in HEK293T cells transfected with ATGL–FLAG, followed by siRNA transfection for 72 h and IP to enrich ATGL–FLAG. Four times repeated independently with similar results. j, Immunoblot of ATGL in HEK293T cells 6 h after glucose withdrawal in the absence of CUL7FBXW8 (n = 5 independent experiments per group). Data are presented as mean ± s.e.m. and analysed using two-tailed unpaired t-test (b and j), two-tailed paired t-test (c), one-way ANOVA method with Dunnett correction for multiple comparisons between control and other groups (a, d and f) and Kruskal–Wallis test with Dunn’s correction for multiple comparisons between control and other groups (g). Source numerical data and unprocessed blots are available in . Source data
**
Fig. 5. Recruitment of FBXW8 to the…
**
**
Fig. 5. Recruitment of FBXW8 to the Golgi via interaction with PtdIns4P.
**
Fig. 5. Recruitment of FBXW8 to the Golgi via interaction with PtdIns4P.
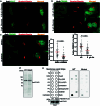
a, Representative photomicrographs of the immunofluorescence of CUL7, FBXW8 and ectopically expressed FBXW8–FLAG in HEK293-AAV cells stained by the indicated antibodies. Scale bar, 5 μm. Repeated independently three times with similar results. b,c, Immunoblot of CUL7 and FBXW8 in the WCE, Golgi and vesicle fractions extracted from HEK293T cells after glucose withdrawal or UCB9608 treatment (n = 6 independent experiments per group). Asterisk indicates a non-specific band. d, Schematic illustration of the domains of human FBXW8. e, Blotting analysis of PIP strips incubated with recombinant proteins FBXW8–FLAG and FBXW8 mutant–FLAG. Three times repeated independently with similar results. f, Immunoblot of recombinant protein FBXW8–FLAG and FBXW8 mutant–FLAG after pull-down by PtdIns4P agarose beads. Three times repeated independently with similar results. g,h, Immunoblot of FBXW8–FLAG and FBXW8 mutant–FLAG in the WCE, Golgi and vesicle fractions extracted from HEK293T cells after glucose withdrawal (n = 6 independent experiments per group). i, Schematic diagram illustrating the working model of the mechanism by which glucose availability is coupled to lipolysis via Golgi PtdIns4P. Results are shown as mean ± s.e.m. and analysed using two-tailed paired t-test (b, c, g and h). Source numerical data and unprocessed blots are available in . Source data
**
Fig. 6. Regulation of lipolysis and MASLD…
**
**
Fig. 6. Regulation of lipolysis and MASLD development via manipulating Golgi PtdIns4P–CUL7 FBXW8 –ATGL axis.
**
Fig. 6. Regulation of lipolysis and MASLD development via manipulating Golgi PtdIns4P–CUL7FBXW8–ATGL axis.
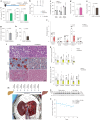
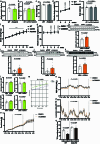
a, Immunoblot of ATGL protein in the liver from hepatocyte-specific Pi4kb knockout mice 2 weeks after AAV8 administration (n = 8 mice per group). b, Immunoblot of ATGL protein in the liver from hepatocyte-specific Cul7 and Fbxw8 knockout mice 2 weeks after AAV8 administration (n = 6 mice per group). c, Immunoblot of ATGL protein in the liver 1 h after 2-DG injection under the background of Cul7 and Fbxw8 double knockout in the hepatocytes (n = 6 mice per group). d, Determination of hepatic TG levels in NCD feeding mice 4 weeks after AAV8 administration or HFD feeding mice 8 weeks after AAV8 administration (n = 10 mice per NCD group and 5 mice per HFD group). e,f, H&E and ORO staining to the liver from hepatocyte-specific Pi4kb (e), Cul7 and Fbxw8 (f) knockout mice under NCD and HFD feeding conditions. Scale bar, 200 μm. Representative images from five mice per group with similar results. g, Determination of hepatic TG levels in hepatocyte-specific Cul7 and Fbxw8 knockout mice fed in NCD and HFD after AAV8 administration (n = 11 mice per NCD group and 5 mice per HFD group). h, Schematic illustration of experimental design to administer UCB9608 to wild-type mice. i, Plasma FFA levels in wild-type mice 8 weeks after administration of DMSO and UCB9608 (n = 12 mice per group). j, Hepatic TG levels in DMSO- and UCB9608-treated mice (n = 15 mice per group). k, H&E and ORO stainings to the liver from DMSO- and UCB9608-treated mice. Scale bar, 200 μm. Representative images from ten mice per group with similar results. Data are presented as mean ± s.e.m. and analysed using two-tailed unpaired t-test (a, c, d and j), two-tailed Mann–Whitney test (i) and one-way ANOVA method with Dunnett correction for multiple comparisons between control and other groups (b and g). Source numerical data and unprocessed blots are available in . Source data
**
Fig. 7. Amelioration of murine MASH progression…
**
**
Fig. 7. Amelioration of murine MASH progression and steatosis in human liver graft via blocking…
**
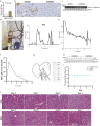
Fig. 7. Amelioration of murine MASH progression and steatosis in human liver graft via blocking Golgi PtdIns4P generation.
a, Schematic illustration of experiment design to administer UCB9608 to wild-type mice after induction of MASH via HFD, high-glucose/fructose-containing water and thermoneutral housing. b, BW gain during the period of UCB9608 treatment (n = 10 mice per group). c, EchoMRI analyses of lean mass, fat mass and BW to the MASH mice (n = 10 mice per group). d,e, Plasma FFA levels (d) and TG levels (e) 12 weeks after administration of UCB9608 (n = 10 mice per group). f, Alanine transaminase (ALT) and aspartate aminotransferase (AST) activity in the plasma from MASH mice after administration of UCB9608 (n = 10 mice per group). g, Liver mass/BW ratio of MASH mice after administration of UCB9608 (n = 10 mice per group). h, Determination of hepatic TG levels of MASH mice after administration of UCB9608 (n = 10 mice per group). i, Representative images of H&E staining, ORO staining and Gomori Green Trichome staining. Scale bar, 25 μm. Representative images from ten mice per group with similar results. j, Histology score of livers from MASH mice treated by DMSO and UCB9608 (n = 10 mice per group). k,l, Transcript levels of inflammatory markers (k) and fibrosis markers (l) in MASH livers as determined by qPCR (n = 10 mice per group). m, Schematic illustration of experiment design to administer UCB9608 to a human liver graft ex vivo during normothermic machine perfusion. n,o, Immunoblot of ATGL protein and quantification of TG levels in the human liver biopsies taken at different timepoints from both lobes. Three times repeated technically with similar results. Results are shown as mean ± s.e.m. and analysed using two-tailed unpaired t-test (b–g and k (Ccl2 and Tnfα) and l (Col1a2, Timp1 and Acta2)), two-tailed Mann–Whitney test (h, j and k (Emr1and Il1b) and l (Tgfb1 and Col1a1)) and two-tailed Pearson’s correlation (o). Source numerical data and unprocessed blots are available in . Source data
**
Extended Data Fig. 1. ATGL-driven lipolysis is…
**
**
Extended Data Fig. 1. ATGL-driven lipolysis is increased in the liver and adipose depots from…
**
Extended Data Fig. 1. ATGL-driven lipolysis is increased in the liver and adipose depots from fasted and glucose-deprived mice.
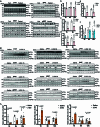
(a) Immunoblots of ATGL, HSLSer660ph, HSL, MGL, PLIN1, CGI-58 and HSP90 in the liver and adipose depots from fed and fasted mice. (b) Plasma glucose levels in the wild-type mice 1 h, 6 h and 12 h after 2-DG (2 g/kg BW) administration (1 h and 6 h, n = 6 mice for saline and 8 mice for 2-DG group; 12 h, n = 6 mice for saline and 7 mice for 2-DG group). (c–e) Levels of glucose and glucose derivatives (glucose-6-p and GA3P) in the livers of wild-type mice collected 1 h and 6 h after 2-DG (2 g/kg BW) administration (n = 6 mice for saline and 8 mice for 2-DG group). (f) Plasma insulin levels in the wild-type mice 1 h, 6 h and 12 h after 2-DG (2 g/kg BW) administration (1 h and 6 h, n = 6 mice for saline and 8 mice for 2-DG group; 12 h, n = 6 mice for saline and 7 mice for 2-DG group). (g) Immunoblots of ATGL, HSLSer660ph, HSL and HSP90 in the liver and adipose depots collected 1 h, 6 h and 12 h after 2-DG (2 g/kg BW) administration. (h) Quantification of HSLSer660ph levels in the adipose depots collected 1h, 6 h and 12 h after 2-DG (2 g/kg BW) administration (1 h and 6 h, n = 6 mice for saline and 8 mice for 2-DG group; 12 h, n = 12 mice for saline and 15 mice for 2-DG group). Results are shown as mean ± s.e.m. and analyzed using two-tailed unpaired t-test (b (12 h), c (1 h), d (6 h), e, f and h (1 h and 12 h in iBAT, iWAT and gWAT)) and two-tailed Mann-Whitney test (b (1 h and 6 h), c (6 h), d (1 h) and h (6 h in iBAT)). Source numerical data and unprocessed blots are available in source data. Source data
**
Extended Data Fig. 2. Glucose deprivation elevates…
**
**
Extended Data Fig. 2. Glucose deprivation elevates systemic lipolysis via upregulating ATGL in the adipose…
**
Extended Data Fig. 2. Glucose deprivation elevates systemic lipolysis via upregulating ATGL in the adipose depots independently of transcriptional changes.
(a) Immunoblots of ATGL, HSLSer660ph, HSL, AKT1, AKT1Ser473ph and HSP90 in the gWAT from wild-type mice after 2-DG (2 g/kg BW) treatment for 5.5 h, followed by insulin (0.75 U/kg BW) administration for 30 minutes (n = 6 mice per group). (b) Quantification of Atgl transcript levels in the liver and adipose depots from fasted mice via qPCR (n = 6 mice per group). (c) Quantification of Atgl transcript levels in the liver and adipose depots collected 1 h after 2-DG (2 g/kg BW) administration (n = 6 mice for saline and 8 mice for 2-DG group). (d) Quantification of Atgl transcript levels in the liver and adipose depots collected 6 h after 2-DG (2 g/kg BW) administration (n = 6 mice for saline and 8 mice for 2-DG group). (e–f) Immunoblot of ATGL in the liver and determination of plasma FFA levels in liver-specific Atgl knockout mice (AtglLKO) 6 h after 2-DG (2 g/kg BW) administration (WT: n = 8 mice for saline and 7 mice for 2-DG group; AtglLKO mice: n = 7 mice per group). (g–h) Immunoblot of ATGL in the iBAT and determination of plasma FFA levels in adipose tissue-specific Atgl knockout mice (AtglAKO) 6 h after 2-DG (2 g/kg BW) administration (WT: n = 4 mice for saline and 5 mice for 2-DG group; AtglAKO: n = 6 mice for saline and 5 mice for 2-DG group). Results are shown as mean ± s.e.m. and analyzed using two-tailed unpaired t-test (b, c (liver, iBAT and iWAT), d, f (WT) and h), two-tailed Mann-Whitney test (c (gWAT) and f (AtglLKO)) and one-way ANOVA method with Tukey correction (a). Source numerical data and unprocessed blots are available in source data. Source data
**
Extended Data Fig. 3. ATGL protein is…
**
**
Extended Data Fig. 3. ATGL protein is stabilized in various cell types treated with glucose…
**
Extended Data Fig. 3. ATGL protein is stabilized in various cell types treated with glucose or serum deprivation.
(a-b) Quantification of ATGL transcript levels in the HepG2 cells 6 h after glucose withdrawal or 50 mM 2-DG treatment (n = 4 independent experiments per group). (c, d) Quantification of Atgl transcript levels in the iBAs 24 h after glucose withdrawal and 100 mM 2-DG treatment (n = 4 independent experiments per group). (e) Immunoblot of ATGL in the HEK293-AAV cells 6 h after glucose withdrawal (n = 6 independent experiments per group). (f) Immunoblot of ATGL in the HEK293-AAV cells 12 h after treatment with 50 mM 2-DG (n = 5 independent experiments per group). (g) Immunoblot of ATGL in the HEK293T cells 6 h after serum withdrawal (n = 10 independent experiments per group). (h, i) Immunoblot of ATGL in the HEK293T cells 6 h after treatment with amino acid or FAs free medium (n = 7 independent experiments per group). (j) Immunoblot of ATGL in the WCE and LD fraction extracted from HepG2 cells 6 h after glucose withdrawal. Three times repeated independently with similar results. (k) Representative images of LDs in the HepG2 cells 48h after treatment with DGAT1/2 inhibitors and stained by BODIPY. Scale bar, 5 μm. Two times repeated independently with similar results. (l, m) Immunoblot of ATGL in the HepG2 cells 6 h after glucose withdrawal or 2-DG treatment in the absence of LDs (n = 4 independent experiments per group). (n) Representative images of Golgi in the HepG2 cells treated with BFA and immunostained with anti-GM130. Scale bar, 20 μm. Two times repeated independently with similar results. (o, p) Immunoblot of ATGL in the HepG2 cells 6 h after glucose withdrawal or 2-DG treatment in the absence of Golgi (n = 4 independent experiments per group). Results are shown as mean ± s.e.m. and analyzed using two-tailed unpaired t-test (a to i, l, m, o (DMSO) and p) and two-tailed Mann-Whitney test (o (BFA)). Source numerical data and unprocessed blots are available in source data. Source data
**
Extended Data Fig. 4. Golgi PtdIns4P regulates…
**
**
Extended Data Fig. 4. Golgi PtdIns4P regulates ATGL protein stability in the Golgi apparatus.
**
Extended Data Fig. 4. Golgi PtdIns4P regulates ATGL protein stability in the Golgi apparatus.
(a) Representative images of P4M-EGFP signal in the HEK293-AAV cells 12 h after glucose deprivation (n = 107 cells per group). Scale bar, 5 μm. (b) Representative images of SACM1L-EGFP signal in the HEK293-AAV cells after glucose deprivation. Scale bar, 5 μm. Three times repeated independently with similar results. (c) Determination of total PtdIns4P levels in the HEK293T cells 24 h after glucose deprivation (n = 9 independent experiments per group). (d) Immunoblot of ATGL and pAMPK in the HEK293T cells after treatment with AMPK inhibitor Compound C (Cpd C) and activator AICAR (n = 4 independent experiments per group). (e) PtdIns4P quantification via immunostaining in the HEK293-AAV cells after treatment with Cpd C and AICAR (n = 67 cells per group). Scale bar, 5 μm. (f–g) Quantification of PtdIns4P levels and Golgi area via immunostaining in the HEK293-AAV cells 72 h after PI4KB and SACM1L knockdown (n = 103 cells per group in f; n = 130 cells per group in g). Scale bar, 5 μm. (h) Quantification of ATGL transcript in the HEK293T cells 72 h after PI4KB and SACM1L knockdown (n = 4 independent experiments per group). (i–j) Quantification of PtdIns4P levels and Golgi area via immunostaining in the HEK293-AAV cells after 24 h treatment with 5 μM PIK93, 10 μM BF738735 and 10 μM UCB9608 (n = 136 cells per group in i; n = 100 cells per group in j). Scale bar, 5 μm. (k) Immunoblot of ectopically expressed ATGL in the HEK293T cells 24 h after treatment with 5 μM PIK93, 10 μM BF738735 and 10 μM UCB9608 (n = 3 independent experiments per group). Results are shown as mean ± s.e.m. and analyzed using two-tailed unpaired t-test (c and d (Ctr and AICAR)), two-tailed Mann-Whitney test (a, d (DMSO and Cpd C) and e), one-way ANOVA method with Dunnett correction for multiple comparisons between control and other groups (h and k) and Kruskal-Wallis test with Dunn’s correction for multiple comparisons between control and other groups (f, g, i and j). Source numerical data and unprocessed blots are available in source data. Source data
**
Extended Data Fig. 5. Glucose deprivation elevates…
**
**
Extended Data Fig. 5. Glucose deprivation elevates ATGL protein in the Golgi via PtdIns4P regulation.
**
Extended Data Fig. 5. Glucose deprivation elevates ATGL protein in the Golgi via PtdIns4P regulation.
(a) Immunoblot of ectopically expressed ATGL in the HepG2 cells 24 h after treatment with 5 μM PIK93, 10 μM BF738735 and 10 μM UCB9608 (n = 3 independent experiments per group). (b) Quantification of Atgl transcript levels in the iBAs 72 h after Pi4kb knockdown (n = 4 independent experiments per group). (c) Quantification of Atgl transcript levels in the iBAs 72 h after Sacm1l knockdown (n = 4 independent experiments per group). (d) Representative images of SACM1L-EGFP and SACM1LK2A-EGFP in the HEK293-AAV cells. Scale bar, 5 μm. Two times repeated independently with similar results. (e) Immunoblot of ATGL in the HEK293T cells 6 h after treatment with glucose free medium under the background of SACM1LK2A-EGFP overexpression (n = 6 independent experiments per group). (f) Immunoblot of ATGL in the HEK293T cells 6 h after glucose deprivation under the background of UCB9608 treatment (n = 6 independent experiments per group). Results are shown as mean ± s.e.m. and analyzed using two-tailed unpaired t-test (e and f) and one-way ANOVA method with Dunnett correction for multiple comparisons between control and other groups (a to c). Source numerical data and unprocessed blots are available in source data. Source data
**
Extended Data Fig. 6. Glucose deprivation decreases…
**
**
Extended Data Fig. 6. Glucose deprivation decreases ATGL poly-ubiquitylation via Golgi resident E3 ligase complex…
**
Extended Data Fig. 6. Glucose deprivation decreases ATGL poly-ubiquitylation via Golgi resident E3 ligase complex CUL7FBXW8.
(a) Immunoblot of ATGL in the HEK293T cells 12 h after treatment with 10 μM MG132 and 100 μM Chloroquine (n = 3 independent experiments per group). (b, c) Immunoblot of ATGL-HA and ATGLK0-HA in the HEK293T cells after glucose withdrawal or 50 mM 2-DG treatment (n = 3 independent experiments per group). (d, e) K48-linkage polyubiquitylation pattern detection of HEK293T cells transfected by ATGL–FLAG and treated with glucose-free medium or 2-DG, followed by IP to enrich ATGL–FLAG. Three times repeated independently with similar results. (f, i) Immunoblot of GP73 in the WCE or secreted GP73 in the medium of HEK293-AAV cells after treatment with 5 μg/mL BFA, 5 μM PIK93, 10 μM BF738735, 10 μM UCB9608 or different siRNAs. Two times repeated independently with similar results. (j) Quantification of ATGL protein levels of HEK293T WCE in a small-scale siRNA screen via immunoblot (n = 22 or 4 independent experiments for control or other groups). (k) Immunoblot of ATGL in the HEK293T cells 72 h after CUL7 and FBXW8 knockdown. Four times repeated independently with similar results. (l) Quantification of ATGL transcript levels in the HEK293T cells 72 h after CUL7 and FBXW8 knockdown (n = 4 independent experiments per group). (m) Representative images of LDs stained via BODIPY in the HEK293-AAV cells 72 h after siRNA knockdown in the presence of 200 μM oleic acid. Scale bar, 20 μm. Three times repeated independently with similar results. (n) Quantification of ATGL transcript levels in the HepG2 cells 72 h after CUL7 and FBXW8 knockdown (n = 4 independent experiments per group). (o) Quantification of Atgl transcript levels in the iBAs 72 h after Cul7 and Fbxw8 knockdown (n = 4 independent experiments per group). Results are shown as mean ± s.e.m. and analyzed using two-tailed unpaired t-test (a to c), one-way ANOVA method with Dunnett correction for multiple comparisons between control and other groups (j, l and n) and Kruskal-Wallis test with Dunn’s correction for multiple comparisons between control and other groups (o). Source numerical data and unprocessed blots are available in source data. Source data
**
Extended Data Fig. 7. Recruitment of FBXW8…
**
**
Extended Data Fig. 7. Recruitment of FBXW8 to the Golgi via interaction with PtdIns4P.
**
Extended Data Fig. 7. Recruitment of FBXW8 to the Golgi via interaction with PtdIns4P.
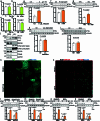
(a) Representative immunofluorescent images of endogenous CUL7 in the HEK293-AAV cells after treatment with glucose free medium. Scale bar, 5 μm. Three times repeated independently with similar results. (b) Representative immunofluorescent images of endogenous FBXW8 in the HEK293-AAV cells after treatment with glucose free medium (n = 64 cells per group). Scale bar, 5 μm. (c) Representative immunofluorescent images of endogenous FBXW8 in the HEK293-AAV cells after treatment with UCB9608 (n = 64 cells per group). Scale bar, 5 μm. (d) Immunoblot of ectopically expressed protein in the HEK293T cells stably expressing FBXW8-FLAG and FBXW8 mutant-FLAG. Two times repeated independently with similar results. (e) Blotting analysis of Membrane Lipid Strips incubated with purified recombinant protein FBXW8-FLAG and FBXW8 mutant-FLAG. Three times repeated independently with similar results. Results are shown as mean ± s.e.m. and analyzed using two-tailed unpaired t-test (b) and two-tailed Mann-Whitney test (c). Source numerical data and unprocessed blots are available in source data. Source data
**
Extended Data Fig. 8. Regulation of ATGL-driven…
**
**
Extended Data Fig. 8. Regulation of ATGL-driven lipolysis and fatty liver development via manipulating Golgi…
**
Extended Data Fig. 8. Regulation of ATGL-driven lipolysis and fatty liver development via manipulating Golgi PtdIns4P- CUL7FBXW8-ATGL axis.
(a) Quantification of Atgl transcript levels in the liver from hepatocyte specific Pi4kb knockout mice (n = 8 mice per group). (b) Quantification of Atgl transcript in the liver from hepatocyte specific Cul7 and Fbxw8 knockout mice (n = 6 mice per group). (c) Body weight of hepatocyte specific Pi4kb knockout mice fed in NCD 4 weeks after AAV8 administration (n = 10 mice per group). (d) Body weight of hepatocyte specific Pi4kb knockout mice fed in HFD 8 weeks after AAV8 administration (n = 5 mice per group). (e) Body weight of hepatocyte specific Cul7 and Fbxw8 knockout mice fed in NCD 4 weeks after AAV8 administration (n = 11 mice per group). (f) Body weight of hepatocyte specific Cul7 and Fbxw8 knockout mice fed in HFD 12 weeks after AAV8 administration (n = 9 mice per group). (g) Body weight gain during the period of UCB9608 treatment (n = 10 mice per group). (h–k) Immunoblot of ATGL protein in the adipose depots and liver from DMSO- and UCB9608-treated mice (n = 12 mice per group). (l) Quantification of Atgl transcript levels in the adipose depots and liver from DMSO- and UCB9608-treated mice via qPCR (n = 12 mice per group). (m–p) Energy expenditure, Respiratory Exchange Ratio (RER), Food intake and Locomotor activity measurement of wild-type mice after 3 weeks administration of UCB9608 via HFD (n = 6 mice per group). (q) Hepatic TG levels in DMSO- and UCB9608-treated wild-type (WT) and liver specific Atgl knockout (AtglLKO) mice (n = 6 mice per group). Results are shown as mean ± s.e.m. (except d, f and g shown as mean ± s.d.) and analyzed using two-tailed unpaired t-test (a, c, d, g (4 and 6 weeks), h to l, and q), two-tailed Mann-Whitney test (g (8 weeks)), ANCOVA (m), one-way ANOVA method with Dunnett correction for multiple comparisons between control and other groups (b, e and f) and two-way ANOVA method (n-p). Source numerical data and unprocessed blots are available in source data. Source data
**
Extended Data Fig. 9. Amelioration of murine…
**
**
Extended Data Fig. 9. Amelioration of murine MASH progression and steatosis in human liver graft…
**
Extended Data Fig. 9. Amelioration of murine MASH progression and steatosis in human liver graft via blocking Golgi PtdIns4P generation.
(a) Measurement of liver fatty acid oxidation using 14C-palmitate as the substrate (n = 10 mice per group). (b) Immunohistological analyses of liver apoptosis in the MASH mice via cleaved Caspase-3 antibody. Scale bar, 25 μm. Representative images from 10 mice per group with similar results. (c) Immunoblot of cleaved Caspase-3 in the adipose tissue from MASH mice. Two times repeated independently with similar results. (d) Bile acid excretion from the liver graft during 8 days of perfusion. (e) Oxygen consumption rate of the liver graft treated with UCB9608 over the course of perfusion. One liver graft used for perfusion. (f) Measurement of NEFA levels in the dialysate. Three times repeated technically with similar results. (g) Time points and locations of punch biopsies from the liver graft. (h, i) Immunoblot of ATGL protein and quantification of TG levels in the human liver biopsies taken at different time points from control grafts. Three times repeated technically with similar results. (j) H&E stainings of biopsies taken at different time points. Scale bar, 50 μm. One liver piece at every time point. Data were presented as mean ± s.e.m. and analyzed using two-tailed Mann-Whitney test (a) and two-tailed Pearson’s correlation (i). Source numerical data and unprocessed blots are available in source data. Source data

